Skip to content


Procurement teams often face a harsh reality when industrial mill lead times, which range from 4 to 14 weeks, clash with the rapid turnaround expected in consumer retail. This gap widens as average U.S. tariff rates climb from 2.4% to over 11%, forcing buyers to navigate a landscape where a single geopolitical shift can delay production by months. Managing these risks requires moving away from reactive purchasing and toward a strategy built on real-time data and regional diversification.
We analyze the primary factors disrupting the stainless steel market, from mill capacity utilization currently averaging 75-76% to the $15,500 nickel price floor. You will find specific lead-time benchmarks for cold-rolled products, an evaluation of “China-plus-one” sourcing, and methods to hedge against alloy surcharge volatility using LME futures. This guide provides the operational tools to secure your 2026 volume while protecting margins against hidden logistics costs and digital vulnerabilities.
The Reality of Mill Lead Times vs. Buyer Expectations
Steel mill lead times typically range from 4 to 14 weeks depending on the product grade and processing requirements, a stark contrast to the 48-hour turnaround often expected by novice buyers. These schedules are influenced by mill capacity utilization, currently averaging 75-76%, and external variables such as maintenance outages and geopolitical tariffs.
Closing the Gap Between Retail Expectations and Industrial Realities
Industrial procurement operates on a timeline far removed from the consumer retail experience. While new participants in the steel market might expect immediate fulfillment, mills manage order books that fill up months before production begins. For example, production slots for early 2026 are frequently secured a full quarter in advance. Experienced buyers mitigate these delays by monitoring mill capacity utilization. When rates hover around 75-76%, it signals that order books will soon close for the season, requiring immediate action to secure necessary volume.
Current Lead Time Benchmarks for Steel Products
Timelines vary based on the level of processing required for the finished good. Hot-rolled coil generally requires 4-6 weeks, but cold-rolled and coated products extend to 8-12 weeks because of the additional stages in the production cycle. Structural tubing and plate deliveries usually fall within the 5-8 week range, though plate orders for Q1 2026 currently require an additional week of lead time due to high demand. For mechanical and DOM tubing, domestic schedules range from 8-14 weeks, while international sourcing can stretch to 6 months when accounting for transit and customs.
External Factors That Extend Delivery Timelines
Several variables outside the buyer’s control can disrupt even the most conservative schedules. Maintenance outages at major facilities, like those operated by Nucor or Cleveland-Cliffs, create immediate backlogs that ripple through the entire supply chain. Geopolitical factors, specifically Section 232 tariffs, tighten domestic supply and add roughly 5-7 days to standard processing times. Furthermore, logistical volatility and seasonal weather patterns introduce delays that mills often do not reflect in the initial quote, making it necessary for buyers to build extra buffer into their project timelines.
Geopolitical Instability and the Impact of Global Trade Tariffs
Trade barriers and geopolitical instability have evolved into systemic macroeconomic shocks, with average effective U.S. tariff rates jumping from 2.4% to over 11% in 2025. These shifts are projected to reduce real growth rates by 0.62 percentage points by 2026 while forcing industrial buyers to navigate volatile lead times and higher country risk premia.
Macroeconomic Shocks and the Rising Cost of Global Trade
Trade barriers currently act as a systemic cost shock rather than a localized issue, with average effective tariff rates reaching their highest levels in decades. In the United States, the average effective rate rose from approximately 2.4% at the start of 2025 to nearly 11.5% by mid-year. Specific trade partners face even steeper hurdles, with average rates on Chinese imports approaching 47.5%. These shifts turn tariffs into a structural burden that impacts every layer of the manufacturing and distribution process.
Projections for 2026 indicate that current trade regimes reduce real growth rates by approximately 0.62 percentage points relative to baseline levels. Tariff-sensitive goods, including consumer durables and industrial machinery, face persistent price pressure as multi-stage supply chain effects magnify the total cost impact. Research suggests that total price effects on intermediate inputs can be up to 30% higher than single-stage estimates when accounting for the full complexity of global production cycles.
Increased country risk premia and currency volatility continue to erode the reliability of lead-time assumptions for global mill orders. Geopolitical instability—encompassing wars, sanctions, and diplomatic rifts—raises the probability of sudden routing bans or asset seizures. These factors increase working capital requirements and force procurement teams to abandon standard lead-time expectations in favor of more conservative, risk-adjusted planning cycles.
Operational Adaptation and the Shift Toward Resilient Trade Corridors
Firms are actively re-routing exports away from high-tariff jurisdictions and toward alternative markets in ASEAN, Africa, and the EU. This geographic pivot helps maintain trade volumes by utilizing less restricted corridors and alternative suppliers. Recent trade data reveals a significant decline in the share of Chinese exports going to the U.S., while imports from Switzerland and Taiwan have surged as companies look to bypass high-cost trade routes and secure critical machinery.
Industrial buyers face longer and more volatile lead times, requiring higher safety-stock levels to mitigate the risk of force majeure events in high-risk corridors. Metal mill orders now typically require a 4-to-7-week planning window, though specialty products can extend beyond 12 weeks. The volatility in trade policy has forced many organizations to front-load orders and over-stock critical items, effectively trading inventory costs for a reduction in disruption risk.
Strategic reshoring and nearshoring initiatives are becoming structural planning factors as companies trade higher production costs for reduced exposure to political rifts. Supply chain diversification, such as China-plus-one strategies, helps manage the trade-off between unit cost efficiency and the stability of material flows. By expanding supplier networks to include both domestic and regional sources, firms can pivot more quickly when faced with regional constraints or sudden regulatory changes.
Navigating Force Majeure and Contractual Risks in Stainless Steel
Managing stainless steel supply chains requires balancing the threat of unforeseeable operational disruptions, such as energy crises and natural disasters, against structural regulatory shifts like CBAM and export licensing. Success depends on prompt notification protocols and diversifying sources toward low-cost production hubs to maintain margins during volatile market cycles.
Unforeseeable Triggers and Operational Disruptions
Natural disasters and logistics bottlenecks frequently impact essential raw material hubs, specifically South African chrome ore mines. These events disrupt the supply of ferrochrome, causing sudden price spikes that cascade through the stainless steel sector. Simultaneously, energy price shocks in Europe and North America marginalize high-cost capacity, often leading to plant shutdowns and reduced utilization rates. When these triggers occur, companies rely on force majeure clauses to excuse non-performance, but these protections require strict adherence to compliance mandates. Most contracts demand documented proof of the event’s impact and a formal notification issued within a narrow window of 7 to 14 days.
Regulatory Risks and Global Trade Barriers
Protectionist trade policies and new oversight systems create structural shocks that decouple local prices from global benchmarks. China’s 2026 steel export license system represents a significant tightening of oversight on global shipments, while the EU Carbon Border Adjustment Mechanism (CBAM) introduces compliance costs that translate into price premiums for non-certified imports. Furthermore, regional duties in India and proposed EU measures significantly reduce import quotas while raising potential tariffs to 50%. These barriers force stakeholders to monitor trade policy changes closely, as a shift in duty levels can immediately erode the reliability of lead-time assumptions and increase working capital requirements.
Strategic Mitigation and Supply Chain Resilience
Firms strengthen their supply chains by diversifying their vendor base to include Indonesia’s low-cost RKEF production, which currently supports an 86% share of Asian production. Shifting to regional suppliers and building inventory buffers allows manufacturers to bypass the “pulse-like” spikes in raw material prices. Proactive contract auditing also serves as a critical defense; veteran buyers incorporate fixed-rate agreements and CBAM-specific clauses to maintain margins amid projected market growth. These strategies trade higher inventory complexity for reduced disruption risk, ensuring that operations remain stable even when geopolitical instability triggers transport blockages or supplier non-performance.
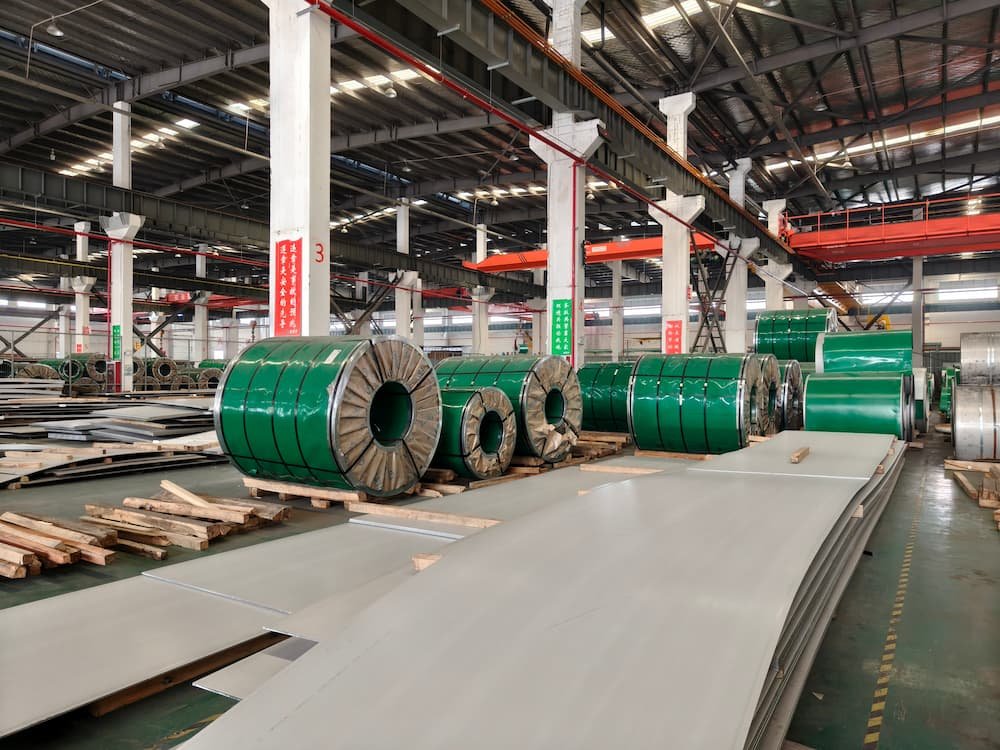
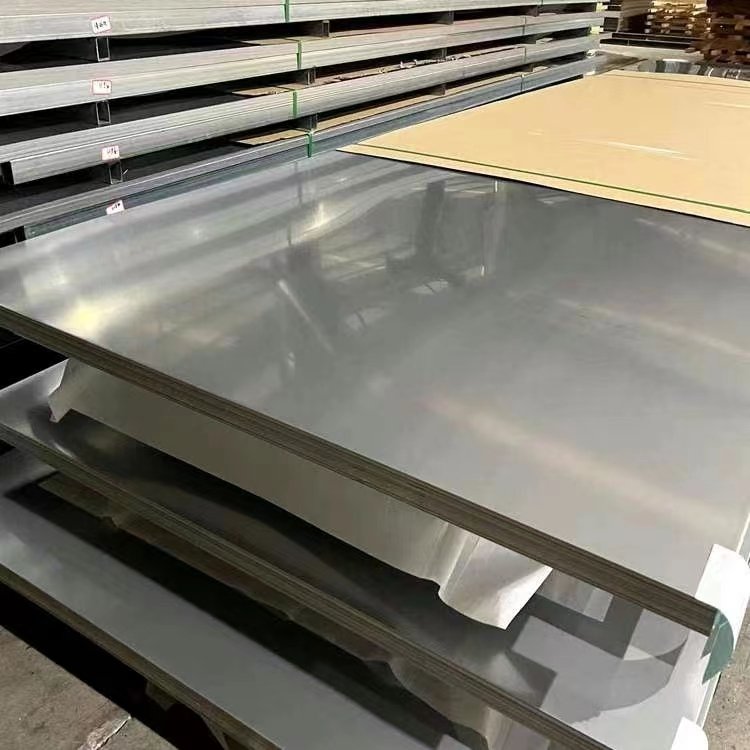
Premium Stainless Steel Sheets Engineered for Excellence
Raw Material Price Volatility: Managing Nickel and Chrome Surcharges
Stainless steel surcharges in 2026 reflect a market defined by structural oversupply, with nickel prices stabilizing between $15,500 and $16,000 per tonne. Successful procurement hinges on monitoring Indonesian mining quotas and using LME futures to hedge against sudden shifts in alloy availability caused by geopolitical tariffs or regional energy crises.
Factors Driving Nickel and Chrome Market Surplus in 2026
The global nickel market faces a projected surplus of 198,000 tons, primarily driven by massive production expansions in Indonesia. This volume outpaces the demand growth from both the stainless steel sector and the cooling EV battery market. While stainless steel production grew by approximately 3-4% to reach 65 million tons, this baseline consumption is not enough to absorb the excess ferronickel supply entering the market. Consequently, LME inventories continue to accumulate, maintaining consistent downward pressure on alloy surcharges throughout the year.
Chrome supply dynamics mirror this volatility, often tracking nickel price movements due to their shared applications in stainless alloys. Risks to chrome availability center on South African logistical constraints and rising electricity costs, which can trigger ferrochrome price spikes even in an oversupplied market. Buyers must account for these regional force majeure events and the 86% Asian market share when calculating total landed costs for high-grade alloys like 316.
Tactical Approaches to Mitigating Alloy Surcharge Fluctuations
Short-term procurement teams mitigate daily price swings by locking in mill orders at fixed prices for immediate production needs. This approach provides cost certainty for projects with tight margins where even minor surcharge fluctuations erode profitability. For longer-term exposure, experienced buyers use LME futures to hedge against volatility, effectively decoupling their contract pricing from the immediate “pulse-like” spikes common in raw material markets. This hedging strategy offsets the risks associated with the US real growth rate reduction and the persistence of high-teen effective tariff rates.
Diversifying material sources beyond primary Indonesian hubs reduces the impact of localized tariffs and mining quotas. Proactive monitoring of geopolitical shifts—such as Western protectionist measures and the EU’s Carbon Border Adjustment Mechanism (CBAM)—allows teams to pivot their supply chains before regulatory changes inflate surcharges. Integrating real-time market indices into supply chain modeling ensures that procurement schedules align with actual inventory levels across the mill network, avoiding the pitfalls of unrealistic 2-day delivery expectations during periods of logistics instability.
Identifying Hidden Risks in Logistics and International Freight
Hidden risks in international freight stem from systemic tariff shocks affecting 82% of supply chains and cybersecurity vulnerabilities that cost large-scale enterprises billions. Current data indicates that only 8% of firms maintain full digital control over their networks, while tier-2 supplier opacity causes significant disruption for shippers who fail to monitor global stress indices and lead-time volatility.
Geopolitical Volatility and Tariff Exposure
Tariffs represent a structural shock to global trade flows, with average effective rates in the United States rising from 2.4% at the beginning of 2025 to approximately 11.5% by mid-year. These adjustments affect 82% of surveyed supply chains, leading to cost hikes that average 39% for consumer goods. Geopolitical tensions frequently trigger spot freight rate spikes exceeding 70% in ocean trade routes, forcing companies to re-route exports away from high-tariff corridors toward alternative markets in the ASEAN region and Taiwan. Additionally, rising cargo theft trends continue to create security gaps that impact 20-40% of standard logistics activities, complicating the reliability of cross-border raw material flows.
Cybersecurity and Digital Chain Vulnerabilities
Digital vulnerabilities have emerged as a core threat to logistics stability, as major system outages cost Fortune 500 enterprises billions in lost revenue and recovery expenses. The 2024 CrowdStrike outage alone resulted in an estimated $5 billion loss, yet only 8% of businesses currently maintain full digital control over their extended supply chain networks. Logistics firms now prioritize proactive modeling and AI-driven analytics to counter cybersecurity breaches that disrupt the movement of global cargo. Without these protective measures, organizations remains susceptible to systemic shocks that cascade through multi-stage supply chains, where total price effects can be 30% higher than single-stage estimates.
Tier-2 Supplier Mapping and Operational Stress
Operational stress often originates from a lack of visibility into deep-tier suppliers. While visibility into tier-2 suppliers increased by 22% recently due to stricter compliance requirements, many firms still struggle to map their full exposure to regional disruptions. Novice shippers face a 76% disruption rate when they lack experience in managing global supply chain stress, often applying unrealistic retail expectations to industrial logistics. Veterans mitigate these risks by monitoring the Global Supply Chain Stress Index, as losses from unforeseen events like energy crises or logistics bottlenecks frequently exceed expectations by 63%. Strengthening these mapping capabilities allows firms to diversify sources beyond high-risk corridors and stabilize lead-time assumptions.
Strategic Mitigation: How to Build a Resilient Stainless Steel Supply Chain
Building a resilient supply chain in 2026 requires a transition from reactive procurement to proactive risk management. Organizations must prioritize multi-source diversification, digital traceability, and rigorous supplier vetting to buffer against lead time volatility, which currently ranges from 4 to 12 weeks for major stainless products.
| Risk Category | Observed Impact (2025-2026) | Strategic Mitigation |
|---|---|---|
| Geopolitical Tariffs | Effective rates rising to 10-15%; China imports near 47.5% | Nearshoring and “China-plus-one” multi-sourcing |
| Lead Time Volatility | HRC: 4-6 weeks; Cold-Rolled: up to 12 weeks | Safety stock buffers and advanced analytics |
| Alloy Surcharges | Nickel stabilized at $15k-$16k; high volatility | LME futures hedging and fixed-rate contracts |
Multi-Source Diversification and Risk Assessment
Expanding supplier networks to include multiple sources for iron ore and scrap metal reduces dependency on high-risk geographic regions. Companies minimize exposure to regional disruptions by sourcing from both domestic and international mills, allowing them to pivot quickly when trade policies shift. This approach is essential given that 82% of supply chains currently face disruptions from new tariff regimes and geopolitical rifts.
Regular risk assessments and scenario planning allow procurement teams to model potential disruptions from trade policies or material shortages. By maintaining risk registers and testing contingency procedures, businesses secure alternative sourcing and logistics before constraints occur in the 2026 market. Successful firms evaluate the trade-off between higher unit production costs in low-risk locations and the volatility of high-risk trade corridors.
Digital Technology and Logistics Infrastructure
Deploying IoT sensors, AI-driven analytics, and blockchain tools provides real-time visibility across the stainless steel supply chain. These technologies enhance traceability, which is increasingly required for compliance with global environmental and trade regulations. Organizations using predictive tools can identify potential bottlenecks, such as port congestion or mill outages, and adjust schedules to maintain production continuity.
Optimizing transportation networks with smart routing and multiple carriers helps bypass regional logistics chokepoints. Adopting Just-in-Time inventory management paired with advanced analytics reduces storage costs while ensuring material availability. Because hidden risks like cybersecurity breaches and cargo theft are rising, investing in secure, digitized logistics infrastructure protects the flow of finished goods and raw materials.
Strategic Supplier Partnerships and Ethical Sourcing
Strengthening relationships through Supplier Relationship Management (SRM) platforms improves reliability through collaborative innovation and mutual crisis support. Sourcing from reputable mills such as Tisco, Ansteel, and Baosteel ensures high-quality standards and strict compliance with Material Test Certificates (MTC). These partnerships create a baseline of trust that is critical during periods of force majeure or sudden market fluctuations.
Integrating sustainable practices and ethical sourcing meets the 2026 regulatory requirements and reduces reputational vulnerabilities. Auditing suppliers for ISO 9001 quality management and environmental compliance demonstrates accountability to customers and regulators. As transparency becomes a top selection criterion, buyers who prioritize documented audit trails and ESG alignment build more resilient, long-term supply networks.
Building Supplier Trust Through Transparency and Quality Audits
Building trust in the steel supply chain requires a transition from subjective assessments to data-driven transparency. By implementing standardized audit criteria, real-time performance dashboards, and third-party verifications like Material Test Certificates (MTC), organizations align with suppliers on quality benchmarks and successfully navigate the lead time volatility and tariff risks of the 2026 procurement landscape.
Establishing Clear Audit Criteria and Performance Baselines
Standardized audit criteria for quality, cost, and delivery remove bias from the evaluation process by applying the same measurable benchmarks to every partner. When buyers share the specific calculation methods used for performance scores, suppliers can accurately identify and resolve operational weaknesses, such as elevated defect rates or inconsistent lead times. Documenting these standards in 2026 procurement contracts provides a clear roadmap for long-term compliance and gives suppliers the necessary stability to plan production schedules around realistic mill lead times, which often reach 8 to 12 weeks for cold-rolled products.
Real-Time Monitoring with Shared Performance Dashboards
Shared dashboards provide a single source of truth for both parties, displaying critical metrics like on-time delivery percentages and sustainability scores in real time. Integrating ISO 9001 quality management systems into these digital platforms verifies that suppliers follow controlled, repeatable processes, which significantly reduces the frequency of disputes over material quality. Current industry data suggests that while transparency initiatives are expanding, many organizations still lack visibility into sub-tier supplier risks; shared data environments help close these gaps and alert stakeholders to potential geopolitical or logistics disruptions before they impact the bottom line.
Third-Party Verification and Material Traceability
Independent inspections from recognized agencies such as SGS or BV provide the external validation necessary to confirm quality claims for global steel shipments. Every shipment must include a Material Test Certificate (MTC) to ensure full traceability and verify that the metal meets the precise technical specifications required for heavy industrial applications. Maintaining comprehensive audit trails—including facility inspections and secure document reviews—demonstrates accountability to regulators and helps mitigate the risks associated with 2025 tariff shocks and shifting trade policies.
Frequently Asked Questions
How long is the typical lead time for mill orders in 2026?
Standard planning for 2026 assumes a lead time of 4–7 weeks from the time of order to shipping readiness. Hot-rolled products generally take 4–5 weeks, while cold-rolled and coated materials typically require 6–7 weeks. Specialty stainless grades can reach 10–12 weeks depending on mill utilization and market demand.
How do mills calculate stainless steel transaction prices?
Prices combine a base rate covering production and margin with variable alloy surcharges tied to nickel, molybdenum, and chromium indices. Final costs also include regional adjustments for energy, transportation, and trade policies like Section 232 or carbon-related duties.
What variables impact the global supply of Grade 316 stainless steel?
Availability depends heavily on the price and supply of molybdenum and nickel. Other factors include mill production schedules, inventory levels at service centers, and trade barriers. Strong demand from the energy and chemical sectors often tightens supply, maintaining a price premium over Grade 304.
What is the best way to vet a new steel supplier?
A structured vetting process includes verifying financial stability, reviewing ISO 9001 certifications, and assessing production capacity. Buyers should also perform background checks for trade compliance and reputation, then establish clear performance metrics for quality and delivery during the initial contract phase.
Why are surcharges added to steel and logistics invoices?
Surcharges account for volatile costs that fall outside standard operations, such as fuel price fluctuations, peak season demand, or environmental compliance fees. These fees ensure service continuity by allowing providers to adjust for shifting external expenses like carbon taxes or terminal handling charges.
How can industrial buyers lower their total shipping costs?
Costs can be reduced by consolidating small orders into larger shipments, optimizing packaging to lower dimensional weight, and negotiating volume-based contracts with carriers. Utilizing route planning software and maintaining regional inventory closer to customers also cuts down on transit times and zone-based fees.
Final Thoughts
Stainless steel buyers navigate a market where mill lead times often reach 14 weeks and effective tariff rates exceed 11%. Success requires moving away from short-term retail expectations and focusing on mill utilization rates and global material surpluses. By securing production slots early and monitoring nickel price stability in Indonesia, firms can manage the gap between order placement and final delivery.
Long-term stability depends on multi-source strategies like the “China-plus-one” model and digital tracking of logistics chokepoints. Vetting suppliers with strict audit criteria and Material Test Certificates protects against the risks of poor quality or non-compliance. As regulatory shifts and geopolitical volatility redefine supply routes, companies that blend proactive hedging with transparent supplier partnerships will protect their operations from systemic shocks.